Structured Products


.png)
.png)
Quantitative trading is a data-driven approach that leverages mathematical models, statistical techniques, and algorithms to identify and execute trading opportunities. Unlike manual or discretionary trading, which relies heavily on human judgment and emotions, quant trading is systematic, scalable, and objective. By analyzing vast datasets and executing trades in small timeframes, it minimizes emotional bias, enhances consistency, and captures market inefficiencies with precision. This makes quant trading especially powerful in today’s fast-paced, information-rich financial markets where speed and accuracy are key.
At P3, the Quantitative Trading Division of 2Cents Capital, we focus on delivering consistent, scalable alpha through systematic and data-driven trading strategies. We combine quantitative research, strategy engineering, and robust risk analytics within a cohesive, innovation-led framework.
In our research team, we explore financial markets through the lens of statistics, econometrics, and machine learning. We work on signal generation, factor modelling, anomaly detection, and regime switching analysis. We rigorously backtest hypotheses using clean data in custom-built simulation environments. These research insights form the backbone of our alpha strategies.
We transform research insights into live trading strategies using a modular, production-grade framework. Our strategies span multiple time horizons and asset classes (primarily Forex and commodities) and incorporate factors like momentum, mean reversion, value, and volatility. Our development process emphasizes backtesting, forward testing, and real-time monitoring to ensure robustness and performance.
We manage capital allocation through a dedicated focus on portfolio and risk analytics. This includes position sizing, drawdown controls, risk attribution, correlation analysis, and stress testing. Using real-time dashboards, we maintain full transparency on performance, risk exposures, and alpha drivers—ensuring portfolio stability even in volatile markets.
We’ve built and operated on Synapse, our proprietary research and strategy development framework based on backtesting.py. Synapse standardizes the research lifecycle—integrating plug-and-play modules for strategy development, transaction cost modeling, alpha combination, and portfolio analytics. It helps us reduce operational overhead and maintain reproducibility across projects. Additionally, we have a Strategy Lab as well, where we seamlessly customize and enhance our strategies.
At P3, we operate at the intersection of quantitative rigor, strategic automation, and robust execution. Our vertically integrated structure, proprietary tooling, and commitment to continuous learning allow us to consistently deliver scalable alpha. We take pride in building strategies that not only perform but prepare us—and our firm—for long-term success in the fast-evolving world of quantitative finance.
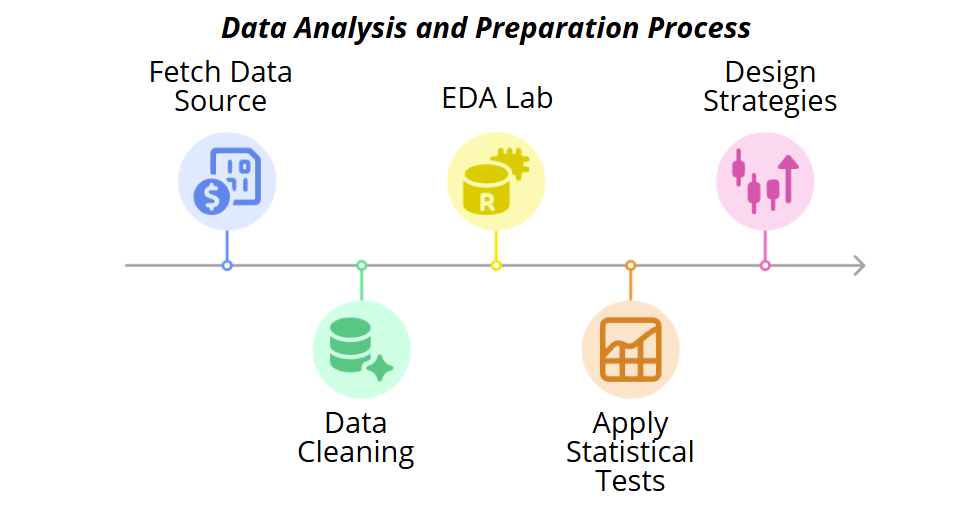
To illustrate our pipeline in action, let us walk you through how the P3 team analyses data and develops a trading strategy from start to finish. For this demonstration, we will focus on the USD/JPY currency pair and guide you step-by-step through the entire process of strategy creation. This will provide a clear understanding of how raw market data is transformed into a systematic trading approach designed to perform effectively in live markets.
In research, data analysis plays a critical role in developing effective predictive models and trading strategies. Statistical and Visualization techniques like Histograms, Boxplots, ADF Test, VIF Scores and Mutual information provide comprehensive insights into data distribution, stationarity, multicollinearity, and nonlinear relationships, enabling more robust feature selection, transformation, and model design tailored to complex market dynamics.
Data Lab is where we understand and prepare our data before any modelling or strategy development. We considered USDJPY Forex Data in our analysis.
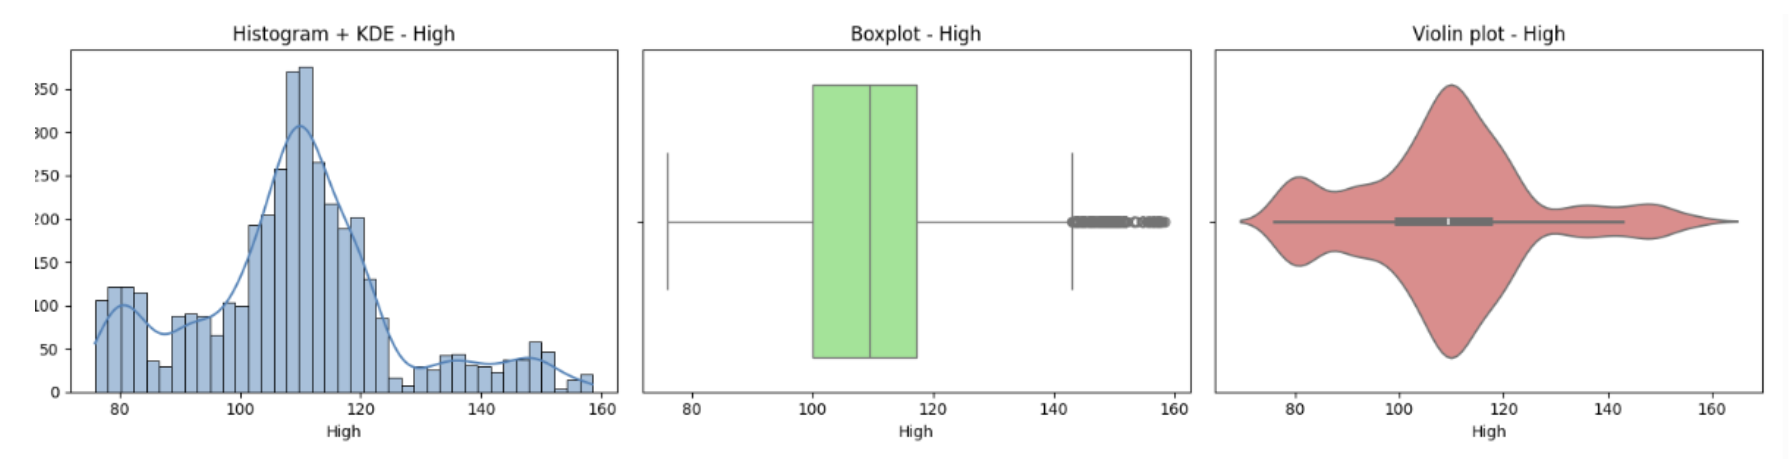
A histogram combined with a KDE curve offers a comprehensive view of a feature’s empirical distribution. The histogram discretely visualizes frequency counts over value intervals, while the KDE provides a smooth, continuous probability density estimate derived from kernel smoothing techniques.
The position of the median within the box plot reveals data asymmetry, while clearly marked outliers help identify extreme values that may bias the model.
The OHLC price features (Open, High, Low, Close) of USDJPY exhibit a roughly unimodal distribution with slight right skew, indicating most prices cluster around a central range but sometimes spike higher. Boxplots show a moderate spread with several high-end outliers, reflecting occasional price jumps. Violin plots confirm these distributions are dense near the centre with asymmetry toward higher values. Volume differs notably, displaying a strong right skew with many low values and occasional extreme spikes. Its boxplot and violin plot reveal frequent, significant outliers due to bursts in trading activity. Overall, prices move cohesively with typical market behaviour, while volume has more variability and heavy tails.
The Augmented Dickey-Fuller (ADF) test checks if a time series is stationary by testing for a unit root. Stationarity is vital for reliable time series modelling and strategies relying on mean reversion. Stationary features are mean-reverting and tend to oscillate around a constant level. A small p-value (typically <0.05) means the feature is stationary (mean-reverting), A large p-value indicates a non-stationary or trending process, which is better suited for momentum or trend-following models.
The ADF test results on USDJPY data show that price features (Open, High, Low, Close) are not mean reverting, indicating these price series do not tend to revert to their rolling mean. Whereas, Volume tends to be mean-reverting.
We have a feature set of 160 features to help us define the dataset and its behaviour we use MI to remove redundant and correlated
Mutual Information (MI) measures how much information two features share, capturing both linear and nonlinear dependencies. From the MI matrix values, very high scores between feature pairs suggest redundancy—they carry overlapping information. Low MI values indicate independence, so both features provide unique information and should usually be retained.
From the MI matrix values of USDJPY, very high scores between feature pairs with high redundancy and overlapping information are suggested to be removed. Low MI values indicate independence, so both features provide unique information and should usually be retained.
Mutual Infornmation(MI) between two dsicrete random variables X and Y is defined as:
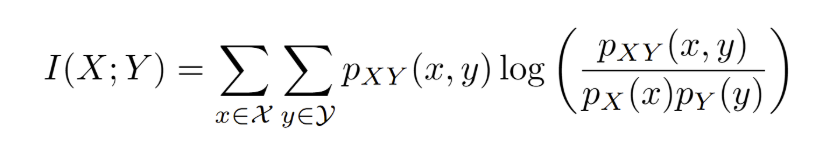
where pxy(x,y) is the joint possibility of X=x and Y=y, and px(x), py(y) are the respective marginals. MI measures the reduction in uncertainity of one variable given the other, capturing linear and non-linear dependencies. In asset or feature analysis, a higher MI indicates stronger predective or shared information between asset features or returns.
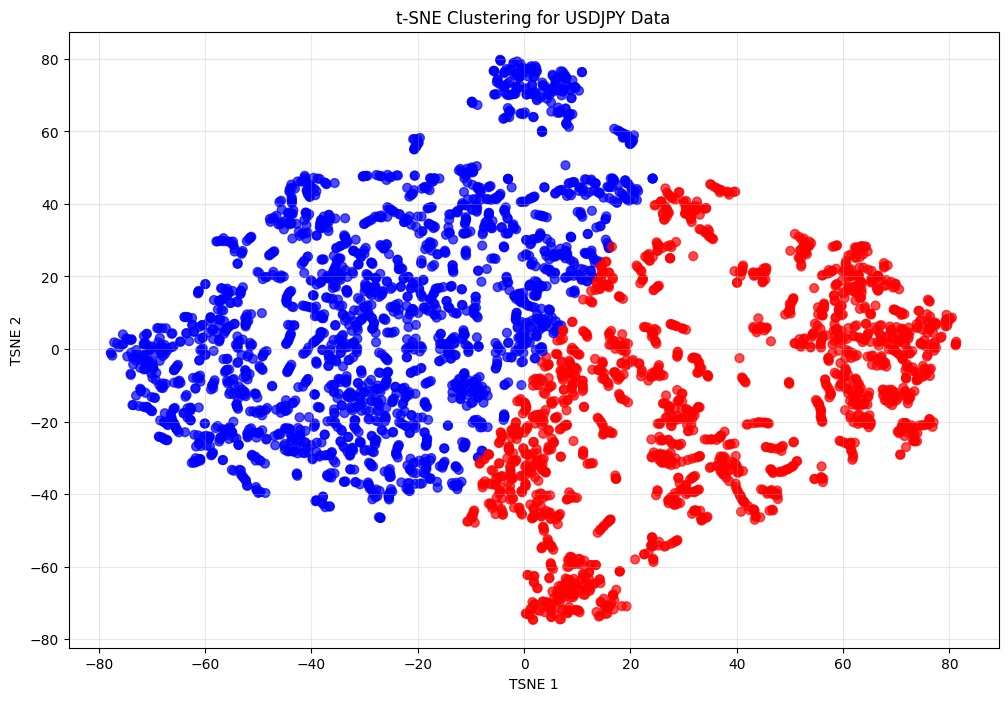
t-SNE is a nonlinear dimensionality reduction technique that projects high-dimensional data into 2D while preserving local neighbourhood relationships. It helps visualize complex patterns by maintaining similarities between nearby points in the original space.
In the figure below, the daily USDJPY data points, each described by 160 features, are reduced to a 2-dimensional t-SNE plot. This visualization reveals clusters that represent different market conditions or regimes. Whenever we have a new data point it falls into any of the existing cluster, it tells about the current market regime.
This trading strategy for forex markets combines Bollinger Bands and VWMA to identify probable entry points.
Our automation pipeline includes a powerful tool called 'Strategy Lab,' developed by our team. This is how it works, the tearsheet generated is passed to this tool, and it will analyse the performance by examining various factors which will include macroeconomic factors like inflation, GDP, national income and other factors like Stock, bond, commodity, and other capital markets, interest rates, top 25 technical indicators chosen by the data analysis tests, sentiment analysis, and more relevant to forex assets. Based on this analysis, Strategy Lab provides targeted filters and insights to help identify where your strategy underperforms and how to optimize it for better results.
Once a strategy has successfully passed our backtesting criteria, the next step is to test it in a real-time market environment—but without risking actual money. We do this by running the strategy in a simulated live setting, to see how it performs with current market conditions. This process is crucial because it helps us confirm that the strategy is not just effective on historical data, but also adaptable and reliable when faced with the uncertainties of today’s markets.
During this forward testing phase, we closely monitor the strategy over several months. We look at how well it performs, whether it remains consistent, and if it handles different market regimes—such as trending or volatile periods—appropriately. If the strategy continues to show strong and stable results throughout this period, we then consider it proven enough to move it into our pool of approved strategies.
From this pool, strategies are selected and allocated capital based on our overall portfolio management framework. This framework is designed to balance risk and reward by combining multiple strategies, ensuring a diversified and resilient portfolio. We will go into more detail about how this portfolio construction process works in our next edition.
.png)
.png)
.png)


Fintech banking advanced technology to offer agile, user friendly & services to traditional banking.


